Use the date fields in the top left corner of the screen to enter a date range for the report, then click the checkmark button (![]() ).
).
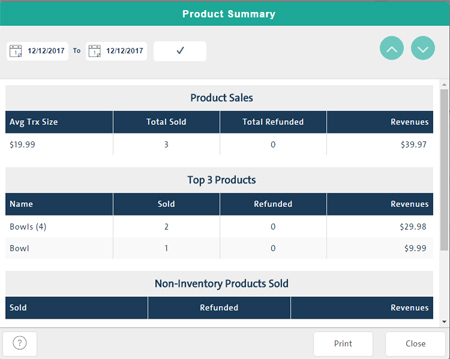
The Product Summary report displays a summary of product sales within a date range.
On the POS view, click the Tools tab.
On the Tools button panel, click Reports.
The Reports popup appears displaying a button for each available report.
Click the Product Summary button.
A report showing product sales summary appears.
Use the date fields in the top left corner of the screen to enter a date range for the report, then click the checkmark button (![]() ).
).
NOTE: The report defaults to today's date.
Click the Print button.
Click the Close button.
The report displays the following information:
Product Sales
Avg Trx Size - The result of the total dollar amount of products sold divided by the number of transactions.
Total Sold - a total quantity of products sold within the date range.
Total Refunded - a total quantity of products refunded/returned within the date range.
Revenues - This is the result of the following calculation; Product retail price x Quantity sold minus Refunded price x Refunded quantity. For example; 5 items sold at $2 each = $10, minus 2 items refunded at $3 each = -$6 therefore total revenue is $4.
Top 3 Products
Name - the name of the top 3 product sold within the date range.
NOTE: "Other" refers to other products sold that are not included in the top 3.
Sold - the quantity of the top 3 products sold within the date range.
Refunded - the quantity of the top 3 products refunded/returned within the date range.
Revenues - This is the result of the following calculation; Product retail price x Quantity sold minus Refunded price x Refunded quantity.
Non-Inventory Products Sold
Sold - the quantity of any non-inventory products sold within the date range.
NOTE: This also includes items sold using the Custom Amounts function in the PAYD Pro Plus Mobile App.
Refunded - the quantity of any non-inventory products refunded/returned within the date range.
Revenues - This is the result of the following calculation; Product retail price x Quantity sold minus Refunded price x Refunded quantity.
Top 3 Categories
Name - the names of the top 3 product categories sold within the date range.
Sold - the quantity of the top 3 product categories sold within the date range.
Revenues - This is the result of the following calculation; Product retail price x Quantity sold minus Refunded price x Refunded quantity.